devlog - how I use chrome devtools
When collaborating on projects and helping debugging websites and web apps, I often notice that a lot of developers miss out on a lot of useful features that Chrome DevTools have to offer, making their debugging experience more painful and time consuming, so I’m presenting my “tool-bag” of Chrome DevTools features that help me solve code issues faster.
General #
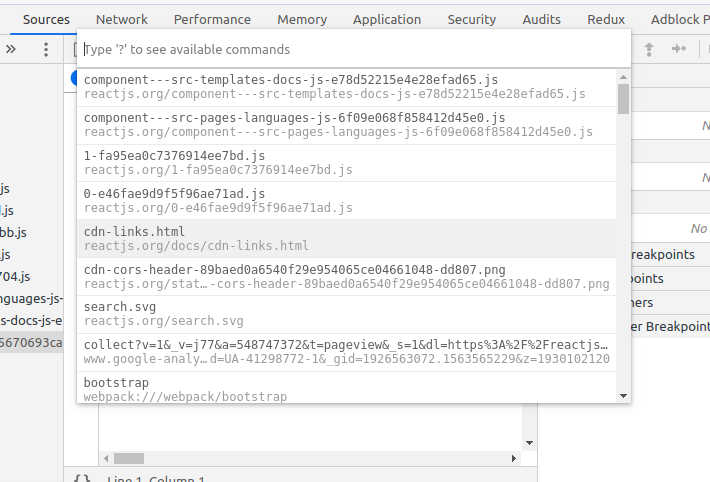
ctrl + p
You may be used to this command from your favorite popular code editors and IDEs, but this is also available inside Chrome DevTools and let’s you open files and resources loaded by the page and browse through them.
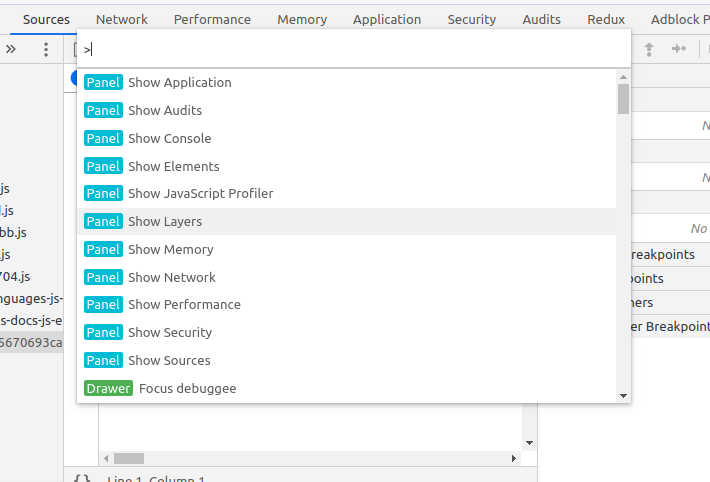
ctrl + shift + p
Similar to the previous shortcut, this one opens a list of all available commands in a nicely formatted list. Super useful shortcut and feature that will certainly introduce you to a lot of other features you may not even notice at first glance. Take your time to go through the list – you will most probably find something new.
Elements tab #
Elements tab presents you with DOM and CSS and is generally used for debugging layout and checking DOM props. But it also contains a few nice hidden features:
Reorder DOM elements
By clicking-holding an element you can actually drag it around and rearrange it’s order or nest it out of it’s parent or move it into another DOM element. Note that by deleting element by element you can sometimes easily identify which one is causing your layout to break.
Shift-click on CSS colors
By holding down shift key you can click on any CSS color and change it’s format. Available formats are: hex, short-hex, rgb and hsl. Switching will convert the values to appropriate format, which is often useful when you need to quickly convert hex to rgba since you decided you want to introduce the alpha channel to the color.
Toggle element state
While it’s nicely visible it’s often a forgotten feature – clicking :hov expands a menu where you can select different element states so you can test the styles for them.
Console #
Timestamps
Hit F1 (or click the three vertical dots in top right corner and select Settings) to open Settings and under the Console section check “timestamps”. Now any console output will have a timestamp printed, which already gives you a better overview of events in time.
console.table()
Besides console.log you probably also use console.error and console.warning, but there is also the very handy way of printing out data with console.table, which often looks much more readable. This is not a Chrome DevTools feature, since you can use it in any console output, but I feel like I should mention it here.
Check MDN for details: https://developer.mozilla.org/en-US/docs/Web/API/Console/table
copy(var)
With copy() you can copy the value of any variable from console to your clipboard.
Preserve log
I always have preserve log turned on in the console settings to keep logs between page refreshes. I use clear if I need to empty the console.
Source tab #
Breakpoints
Amazing as it is the debugger statement is often ignored by JS developers. Stopping code inside your functions is the most common way of debugging in most languages, but somehow it is not the go-to practice in the JS world, where throwing console.logs all over the place is the most seen practice. Using debugger will let you easily access and print out any variable to the console, but also will enable you to step through your code line by line and facilitate identifying the problematic line. DevTools also let you place inline breakpoints on-the-fly, that speed up the debugging when you just want to skip a few lines of code and stop at another point, and also let you step into functions.
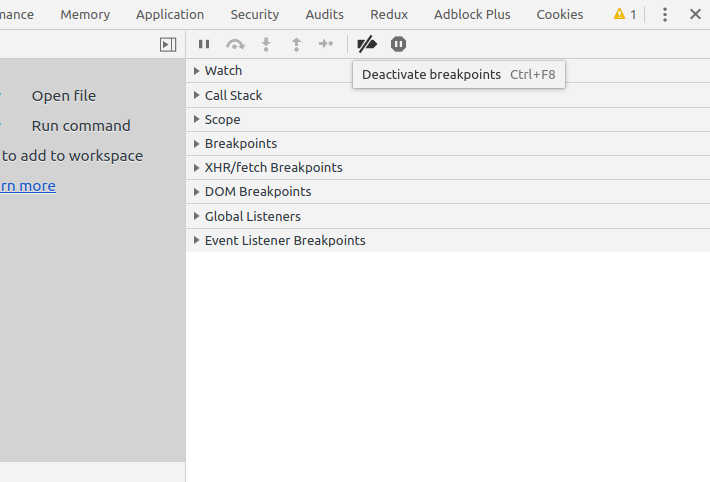
Deactivate breakpoints
When debugging a complex problem you will usually end up with multiple breakpoints cross multiple functions. When trying out a solution, you can quickly deactivate all breakpoints and let the code run to the end without having to manually progress over breakpoints.
Pause on exception
Sometimes you deal with errors that show up once your app has been running for some time or you just want to stop before the error throws. Enabling pause on exception will catch the error when it happens and pause code execution right before throwing it, letting you analyze the last state before it happened.
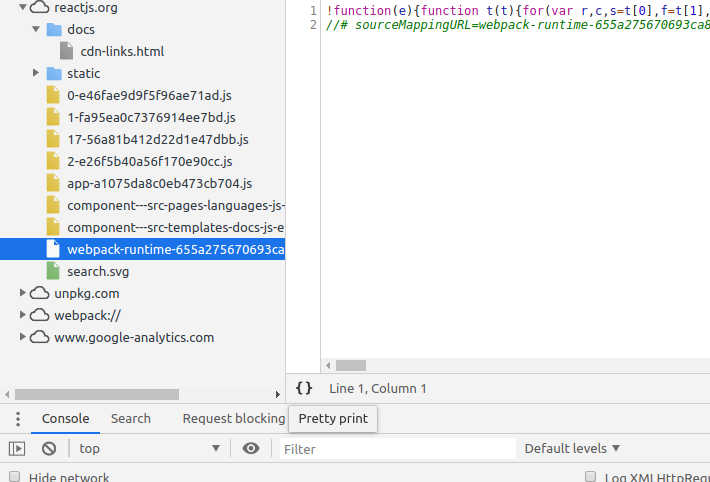
Pretty print
When catching production only bugs, you will often have to deal with hard-to-read minified code. Clicking the pretty print button will reformat back to a human readable source and let you place inline breakpoints on it.
Network tab #
Network tab is straight forward with it’s UI – two features I’d like to expose:
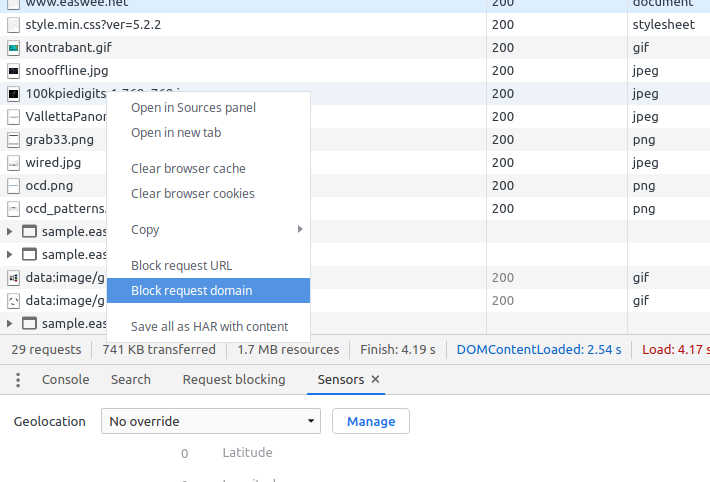
Block request URL / domain
When you need to test how something would render if a network request is blocked or fails, you can temporarily block/unblock specific URLs or entire domain by right clicking on the specific item from the list and selecting it in the menu. Useful also to quickly check out alt texts by blocking image URLs.
Bandwidth throttling
This comes handy when your app rendering depends on the network speed and you want to see how partially loaded containers look like or check loading animations.
Performance tab #
CPU throttling
When you want to simulate the rendering of a low-tier device with bad CPU you can slow down the profiler by setting a 6x or 10x slower CPU rendering simulation, and see which potential bottlenecks in rendering times can arise when you don’t have powerful CPUs available.
Save/Load profile
After each profiling you can also save the data gathered and load it later for comparison when optimizations have been done on your code.
Rest of tabs mostly contain just various data representation and analysis and are straight forward obvious to read and understand.
Don’t forget that there are also many additional plugins you can add to Chrome DevTools depending on which technologies you use on your project. Check out Chrome Web Store to see what’s available on: https://chrome.google.com/webstore/category/ext/11-web-development